
Portfolio snapshot
The "Portfolio snapshot" dashboard shows on one Excel sheet what your exchange account holds and what it is worth in the currency you choose: a chart of your largest holdings by value, your balances with their price and value, and what came in and went out of the account lately.
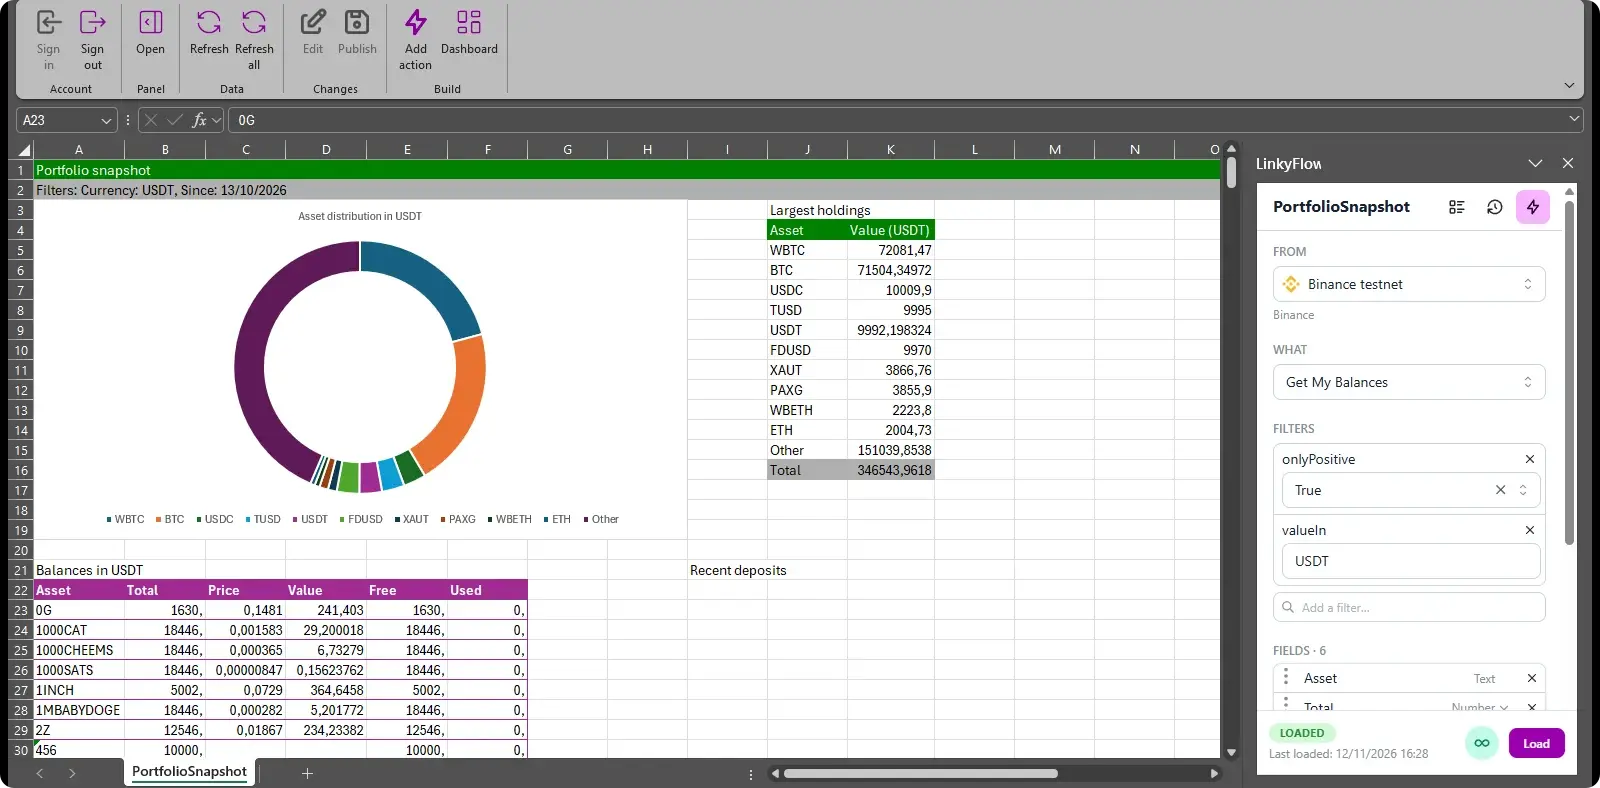
Captured on a Binance Spot testnet account, which holds paper funds in several hundred assets, priced at the testnet's own prices, and keeps no deposit or withdrawal history (Binance serves it from an API the testnet does not host): "Recent deposits" and "Recent withdrawals" stay empty there. On a live account they list them.
Build it
- In Excel's ribbon, LinkyFlow tab → "Dashboard".
- In "Portfolio snapshot", choose your exchange connection under "Link". "Currency" is the one every balance is valued in: USDT unless you change it (USDC, EUR, BTC…). "Since" is where the deposits and withdrawals start: 30 days ago unless you change it.
- Optionally choose an "Auto-refresh" interval under Options, then click "Build".
What the sheet holds
The PortfolioSnapshot sheet, under a line that recalls the filters:
- Asset distribution: a doughnut chart of what your ten largest holdings are worth in the currency, and of the rest as "Other".
- Largest holdings: the table the chart reads — those ten assets and their value, "Other", and the total.
- Balances in your currency (Get My Balances): every asset with a positive balance — total, price, value, free, and used (held by open orders).
- Recent deposits (Get My Deposits): up to 40 deposits since the date — date, currency, amount, status, fee.
- Recent withdrawals (Get My Withdrawals): up to 40 withdrawals since the date, with the same columns.
How the value is computed
- LinkyFlow prices each asset at the last price of its market against your currency on the same exchange (BTC/USDT for BTC in USDT), and the value is total × price. The currency itself is worth 1.
- An asset with no market against your currency on that exchange has no price: its Price and Value cells stay empty, and the chart and the total leave it out. No rate is crossed through a third asset.
- The chart and the lists never overlap: the chart sits above the lists, which grow down as long as your account.
Notes
- A read-only key is enough (connect your exchange API key). "Refresh all" in the ribbon loads every table of the sheet again, prices included, and the chart follows.