
Funding flows insights
The "Funding flows insights" dashboard follows the money that comes in and goes out of your exchange account over a period: every deposit, every withdrawal, the balances they lead to, and the totals with their chart.
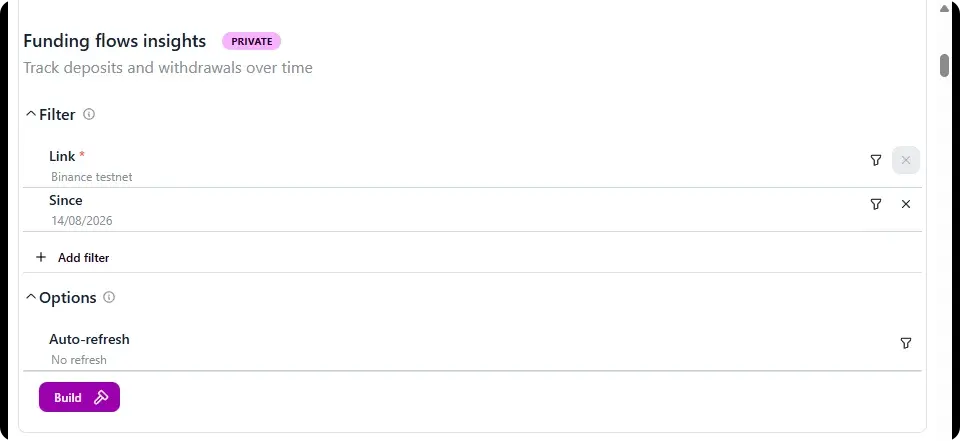
No capture of the filled sheet here: the account LinkyFlow shows its dashboards on is a Binance Spot testnet account, and the testnet keeps no deposit or withdrawal history (Binance serves it from an API the testnet does not host).
Build it
- In Excel's ribbon, LinkyFlow tab → "Dashboard".
- In "Funding flows insights", choose your exchange connection under "Link". "Since" is where the period starts: 90 days ago unless you change it. "Add filter" adds the asset filter, to keep one asset, for example BTC.
- Optionally choose an "Auto-refresh" interval under Options, then click "Build".
What the sheet holds
The FundingFlows sheet, under a line that recalls the filters:
- Deposits (Get My Deposits): up to 100 deposits since the date — date, currency, amount, status, fee and its currency.
- Withdrawals (Get My Withdrawals): up to 100 withdrawals since the date, with the same columns.
- Current balances (Get My Balances): every asset you hold today, with its total.
- Totals, right of the balances: total deposits, total withdrawals and the net flow (deposits minus withdrawals) as Excel formulas over the two tables, and the "Funding totals" column chart of the three.
Notes
- The totals add the amounts as they come, whatever their currency: filter on one asset to read them in that asset.
- A read-only key is enough (connect your exchange API key). "Refresh all" in the ribbon loads every table of the sheet again, and the totals follow.