
Multi-symbol watchlist
The "Multi-symbol watchlist" dashboard follows several trading pairs on one Excel sheet — last price, bid, ask and 24-hour change of each — next to your balances and your account's recent deposits and withdrawals.
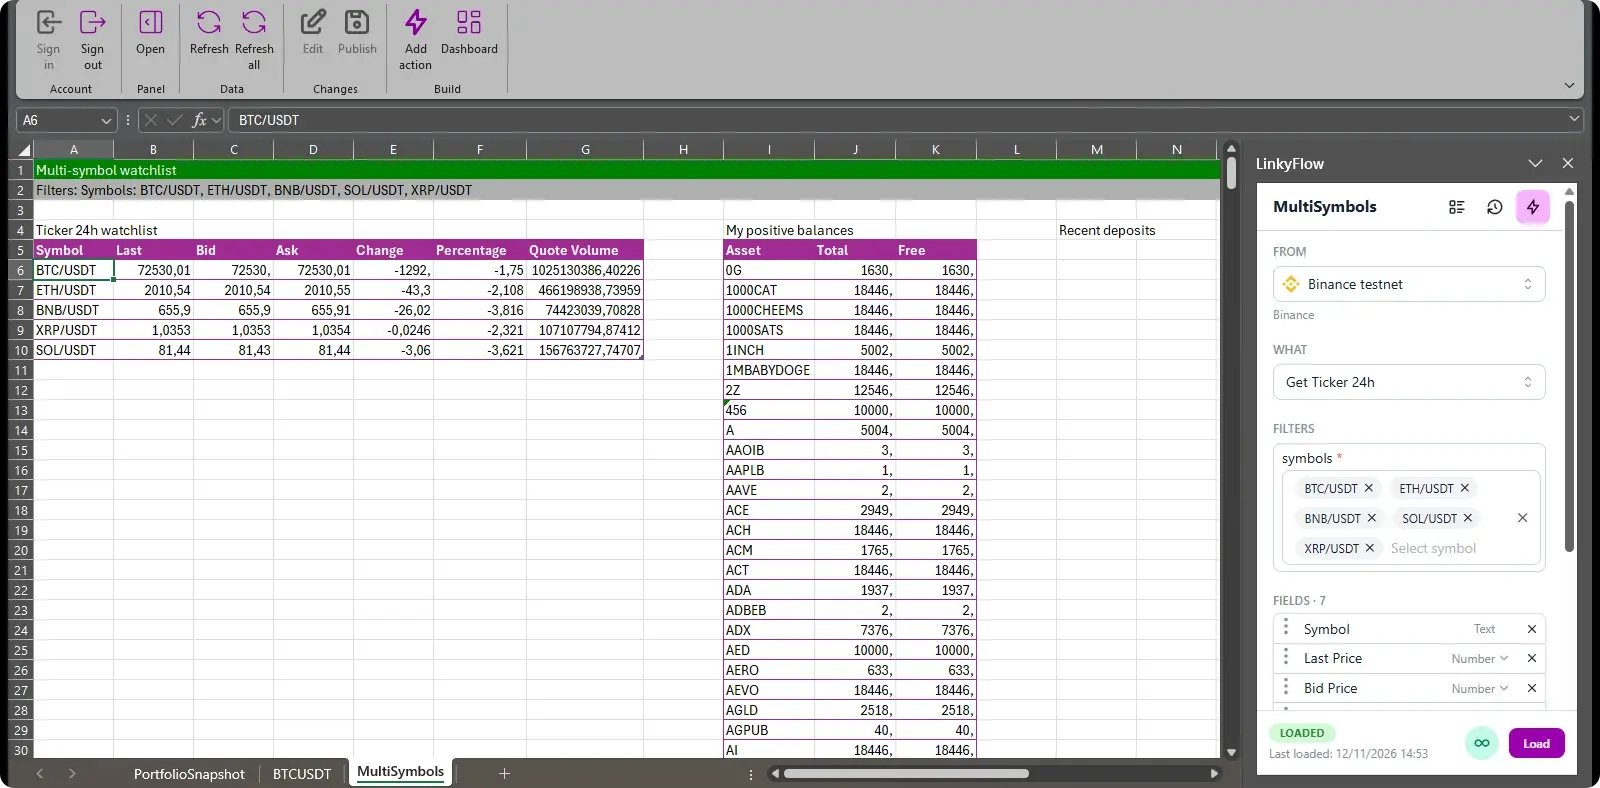
Captured on a Binance Spot testnet account: the ticker shows Binance's public prices, the balances the testnet's paper funds. The testnet keeps no deposit or withdrawal history, so the two blocks right of the balances stay empty there.
Build it
- In Excel's ribbon, LinkyFlow tab → "Dashboard".
- In "Multi-symbol watchlist", choose your exchange connection under "Link", then the pairs to follow under "Symbols", for example BTC/USDT, ETH/USDT, BNB/USDT, SOL/USDT and XRP/USDT.
- Optionally choose an "Auto-refresh" interval under Options, then click "Build".
What the sheet holds
The MultiSymbols sheet, its blocks side by side from row 5, each as long as its list:
- Ticker 24h watchlist (Get Ticker 24h): one row per symbol — last price, bid, ask, change, percentage and quote volume over 24 hours.
- My positive balances (Get My Balances): every asset you hold, total and free.
- Recent deposits (Get My Deposits): your 20 latest deposits — date, currency, amount, status.
- Recent withdrawals (Get My Withdrawals): your 20 latest withdrawals, with the same columns.
Notes
- To change the symbols later, select a cell of the ticker: the LinkyFlow pane shows its query, where you add or remove symbols, then "Load".
- The ticker reads Binance's public data. The other blocks read the exchange account of the connection chosen under "Link": a read-only key is enough for them (connect your exchange API key).
- "Refresh all" in the ribbon loads every table of the sheet again.